Decision-Making and Data in Teaching
Teaching involves a lot of decision making. When creating and teaching a lesson, decisions have to be made constantly, including during the initial planning phase. These decisions include
- how to start class, ways to sequence ideas or activities within the lesson;
- how to assess students’ understanding of the content;
- when to make these assessments;
- how to group students;
- what work to have students produce;
- where to position ourselves at different points in the lesson; and
- how to close the lesson.
While that list is not exhaustive, it highlights how decisions occur throughout all aspects of a class.
Teaching also involves a lot of data. Each decision leads to lots of new information that could tell you about the impact of your decision (e.g., How did students respond to the initial warm-up question? Were they ready to discuss the warm-up when you sought their attention? What questions or points of confusion, if any, were raised, when the class transitioned from the initial activity to the one that followed it?). In addition to using data to reflect on past decisions, you can use data to inform future decisions, such as how you will begin tomorrow’s lesson or how you will sequence content or activities next year when covering the same unit.
Data and decision making go hand in hand. We can use data to inform our decisions, and our decisions can generate more or less useful data for us. But what makes data “useful”? Before explaining what “useful data” is, it can be important to first clarify what I mean by data.
![]()
What Is Data?
In the paragraphs, above I’ve been using data to mean any information that can tell me what students know or are able to do. In science, technology, engineering, and mathematics (STEM), there is often a large emphasis placed on numerical, or quantitative, data. These numbers often serve as data in experiments, projects, or problems. Likewise, many conversations about “data” in schools and education today place a great emphasis on such quantitative information. And so, while all these factors point to the view of data being numbers, I want to encourage us to think of data more broadly.
Data can involve the responses students share to questions students and teachers raise in class. It can be how students handle equipment during a lab. It can be their discussions with other students about an engineering project. All of this information provides valuable data about what students know, or are able to do, with content or related skills, and it can be difficult to attach numbers to this information. So, in sum, I view data as any information about what students know or are able to do, and it can be quantitative or qualitative.

Using Data to Make Decisions
With such a broad definition of data, you might realize that there is a nearly infinite amount of data a teacher could focus on. Many people might focus on quantitative test scores, often arising from end-of-unit or end-of-semester assessments, as indicators of what students know or are able to do. Yet there’s other, more diverse data, that you could (and probably often do!) use each lesson to support you in making decisions that will benefit student learning.
And so I return to the idea of more or less useful data. The usefulness of data is contingent on how well it informs us of whatever interests us. As teachers, what interests us is often what students know or are able to do. That is our goal. And with each particular lesson or activity, we have targeted goals identifying specific things we want students to know or be able to do.
Once you know one or more goals for a lesson or activity, it’s important to identify how you will find out how well each goal has been met. To do that, you will use some tools. These tools could be labs students complete, projects they develop, worksheet questions they answer, discussions they engage in during class, or something else. It’s critical that these tools connect to your goal(s). The tools should lead students to generate data that is directly related to your goal. In other words, the data arising from the tool should provide you with information about what students know, or are able to do, around what interests you. Reviewing the data, which can be qualitative or quantitative, you can make inferences, or claims identifying patterns or trends in the data that can tell you how well each goal has been met. That data can support you in making decisions about next steps to take with the class as well as what to possibly do in the future.
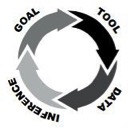
The cycle described above and seen in Figure 1 provides a framework for data-based decision making that can support you in formatively assessing how well students know and are able to do what is important to you and your course. Instead of waiting until a summative assessment, such as an end-of-unit test, you can use this cycle to support you in making adjustments throughout an individual lesson or series of lessons to better support student learning. That’s a major benefit of formative assessments! This framework, including additional ideas and resources related to formative assessment, is something my coauthors and I call the Feedback Loop in our book The Feedback Loop: Using Formative Assessment Data for Science Teaching and Learning.
Example
To help make the above framework more concrete, here’s one example of it that could occur during a portion of one lesson:
- Goal – Students will appropriately apply the law of conservation of momentum to predict what will happen in collisions.
- Tool – Students will watch, and predict the outcome of, simulations of collisions. For each collision, they will be provided multiple-choice options, asked to choose their answer, and allowed to discuss reasons for their decisions.
- Data – There are two pieces of data that will be generated, including (1) how many students voted for each option and (2) the reasons provided for their selections.
- Inferences – Using their votes and associated reasons, a teacher could feel more confident making claims about how well the students could apply the law of conservation of momentum to predict outcomes of collisions or might have a better sense of points of confusion, or possible preconceptions, they exhibit
Closing Thoughts
Teaching involves a constant flow between data and decision-making. Data can be incredibly valuable in making better decisions that support you and your students in making good progress towards learning goals. As you reflect on this process and your experiences, how has (or could) data benefit decisions you’ve made as a teacher? What have you found to be the most valuable tools for specific goals? How can you embed these ideas within your lessons so you’re regularly generating data to support your decision-making process?
Reference
Furtak, E. M., Glasser, H. M., & Wolfe, Z. M. (2016). The Feedback Loop: Using formative assessment data for science teaching and learning. Arlington, VA: NSTA Press.
Note: The Feedback Loop is available for purchase from the NSTA Science store (www.nsta.org/store)